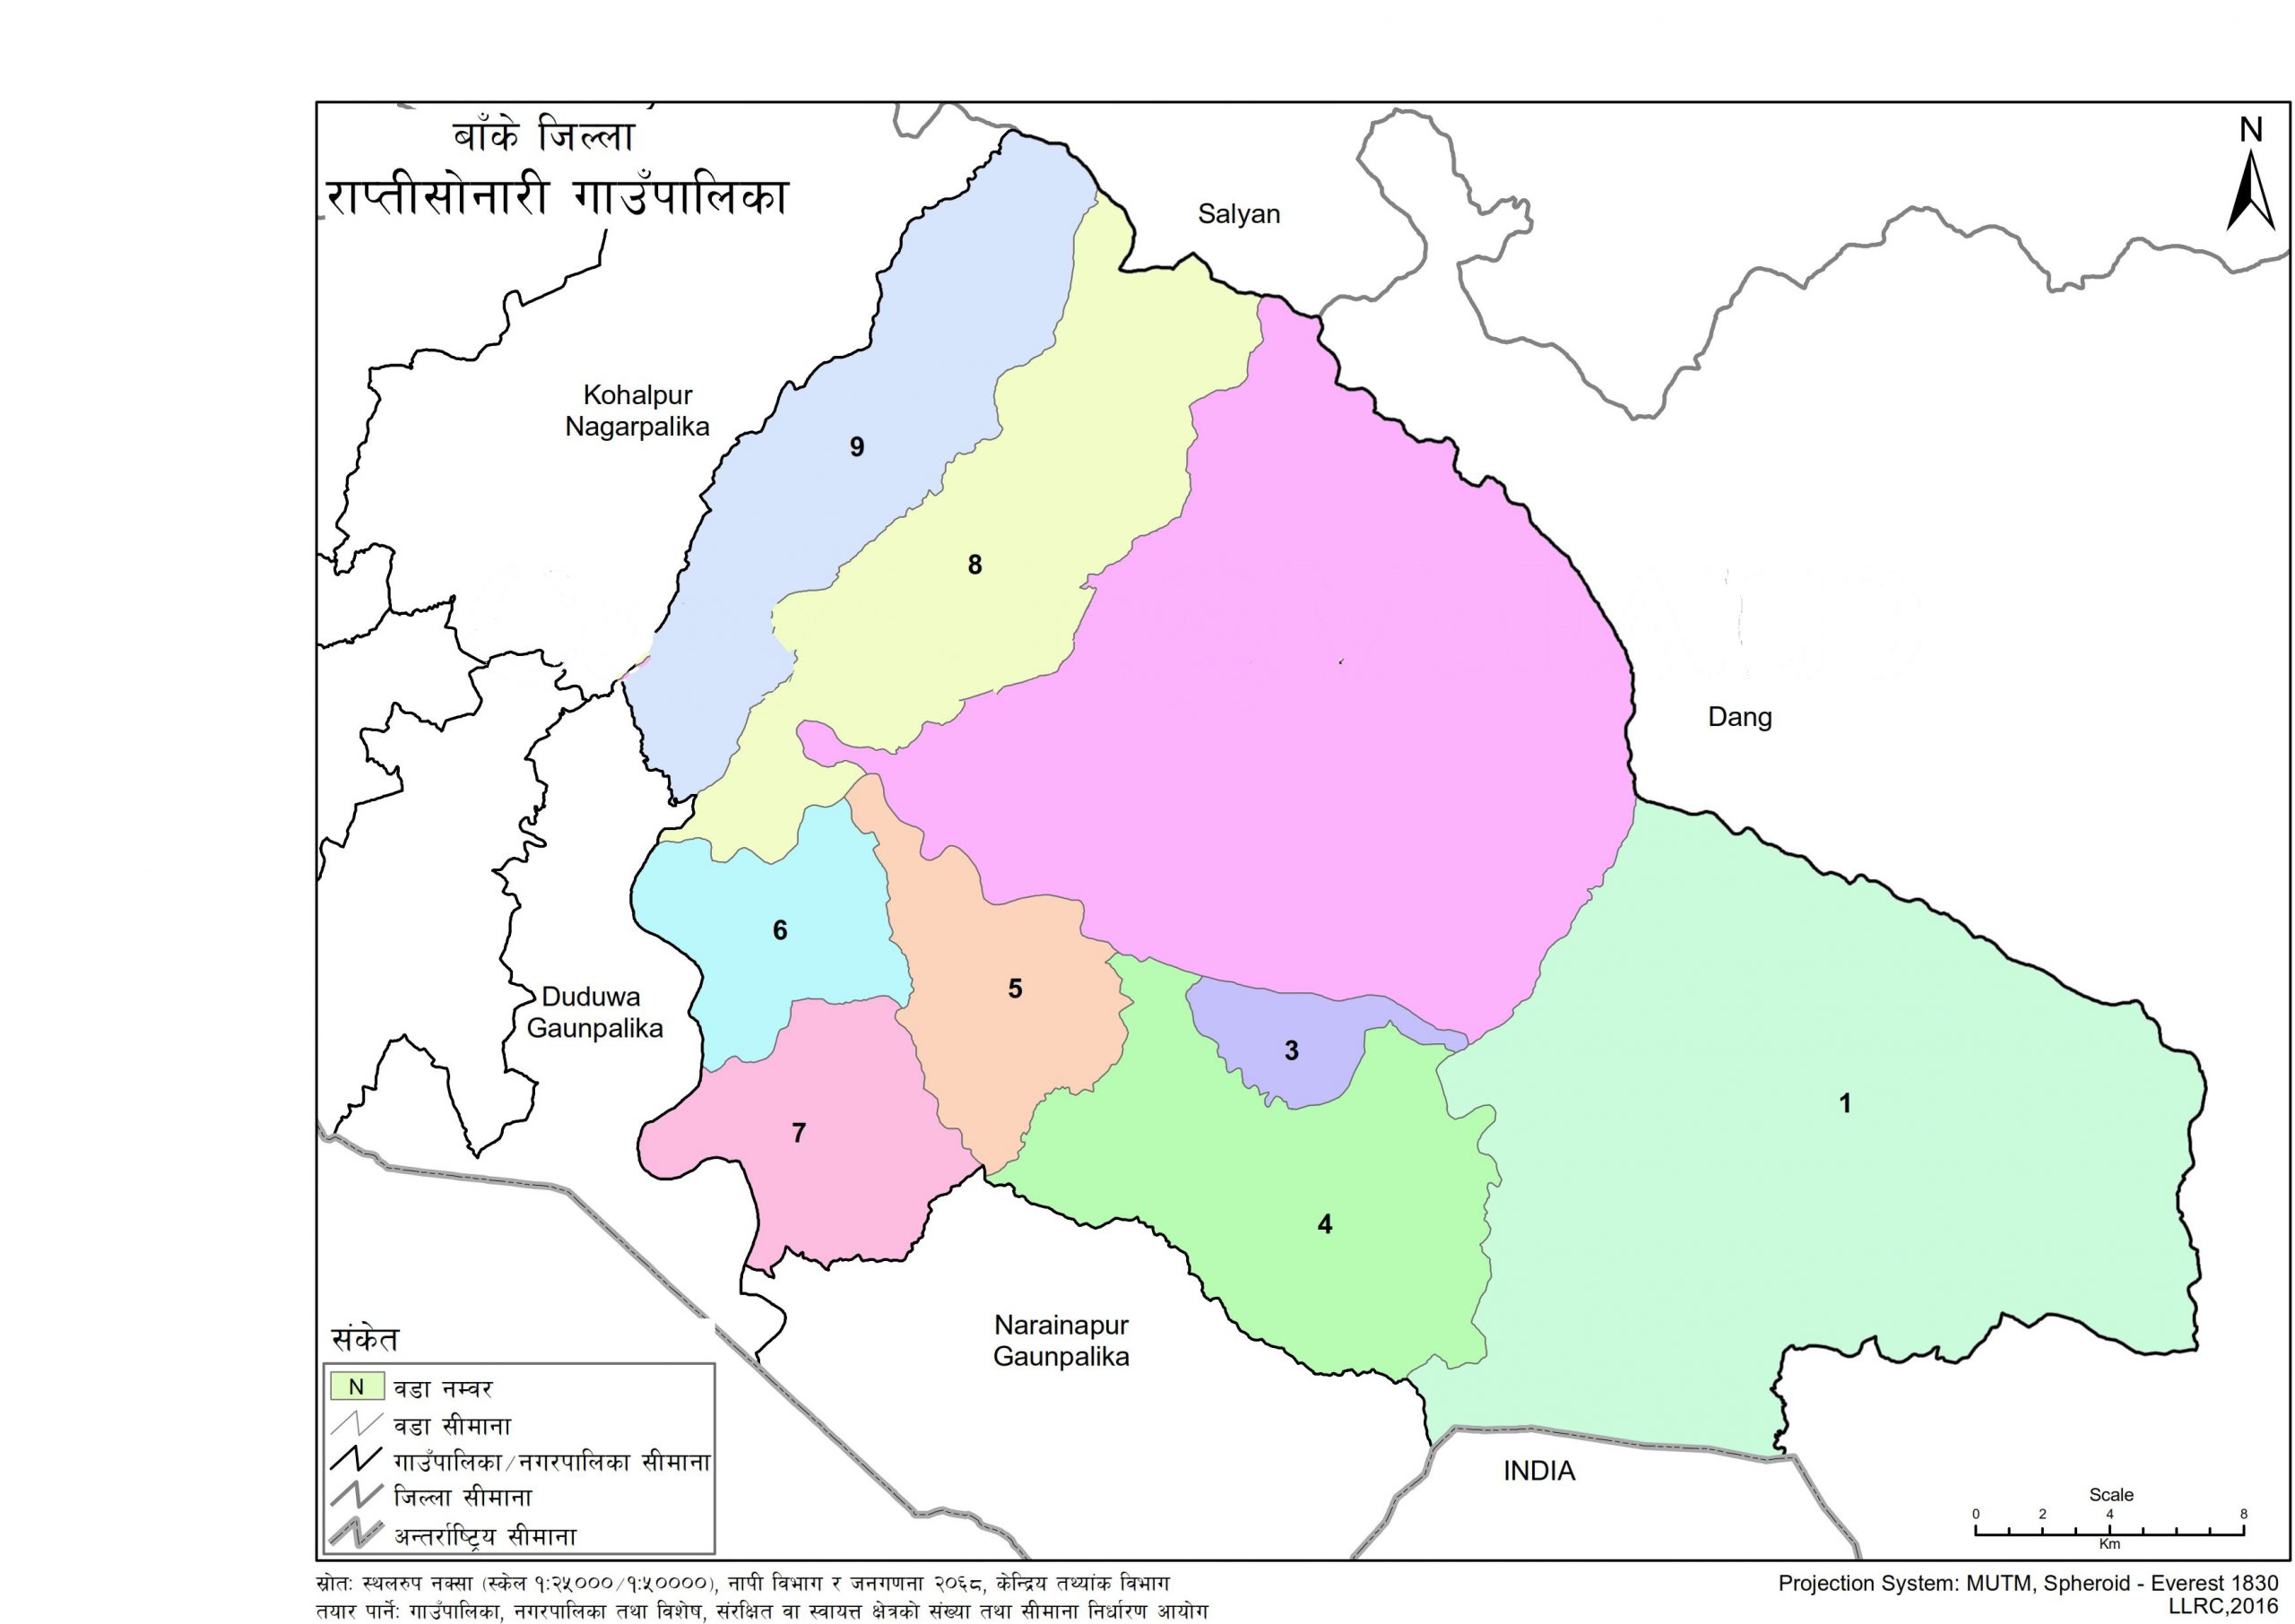
Rapti Sonari Rural Municipality Profile | Facts & Statistics
Rapti Sonari is a Rural Municipality located in Banke District of Nepal. It has total 9 wards and 1,042 square kilometers of geographical area. According to 2011 census, it had total population of 59,946.
Wardwise Population and Households
As per 2011 population census, Rapti Sonari Rural Municipality had total 59,946 population with 28,617 males and 31,329 females. Out of total wards, ward number 7 had the largest population 9,560, while ward number 8 had least number of population with 9,560.
With respect to number of households, Rapti Sonari Rural Municipality had total 10,742 households. The ward number 2 had most households with total 1,703, while ward number 3 had least number of households with total 744 number of households.
As illustrated in the chart, the ratio of male to female population was 0.91, which indicates that Rapti Sonari Rural Municipality had 9 percent lower males as compared to the females. Same as, the population to household ratio was 5.58, which means that in average 5.58 family members lived in each household.
Absentee Population

As illustrated in the charts, the ratio of absentee population was 14.11, while male to female absentee population ratio was 6.79. Same as, the household ratio of present vs. absent population was 2.86.
Population by Age Group
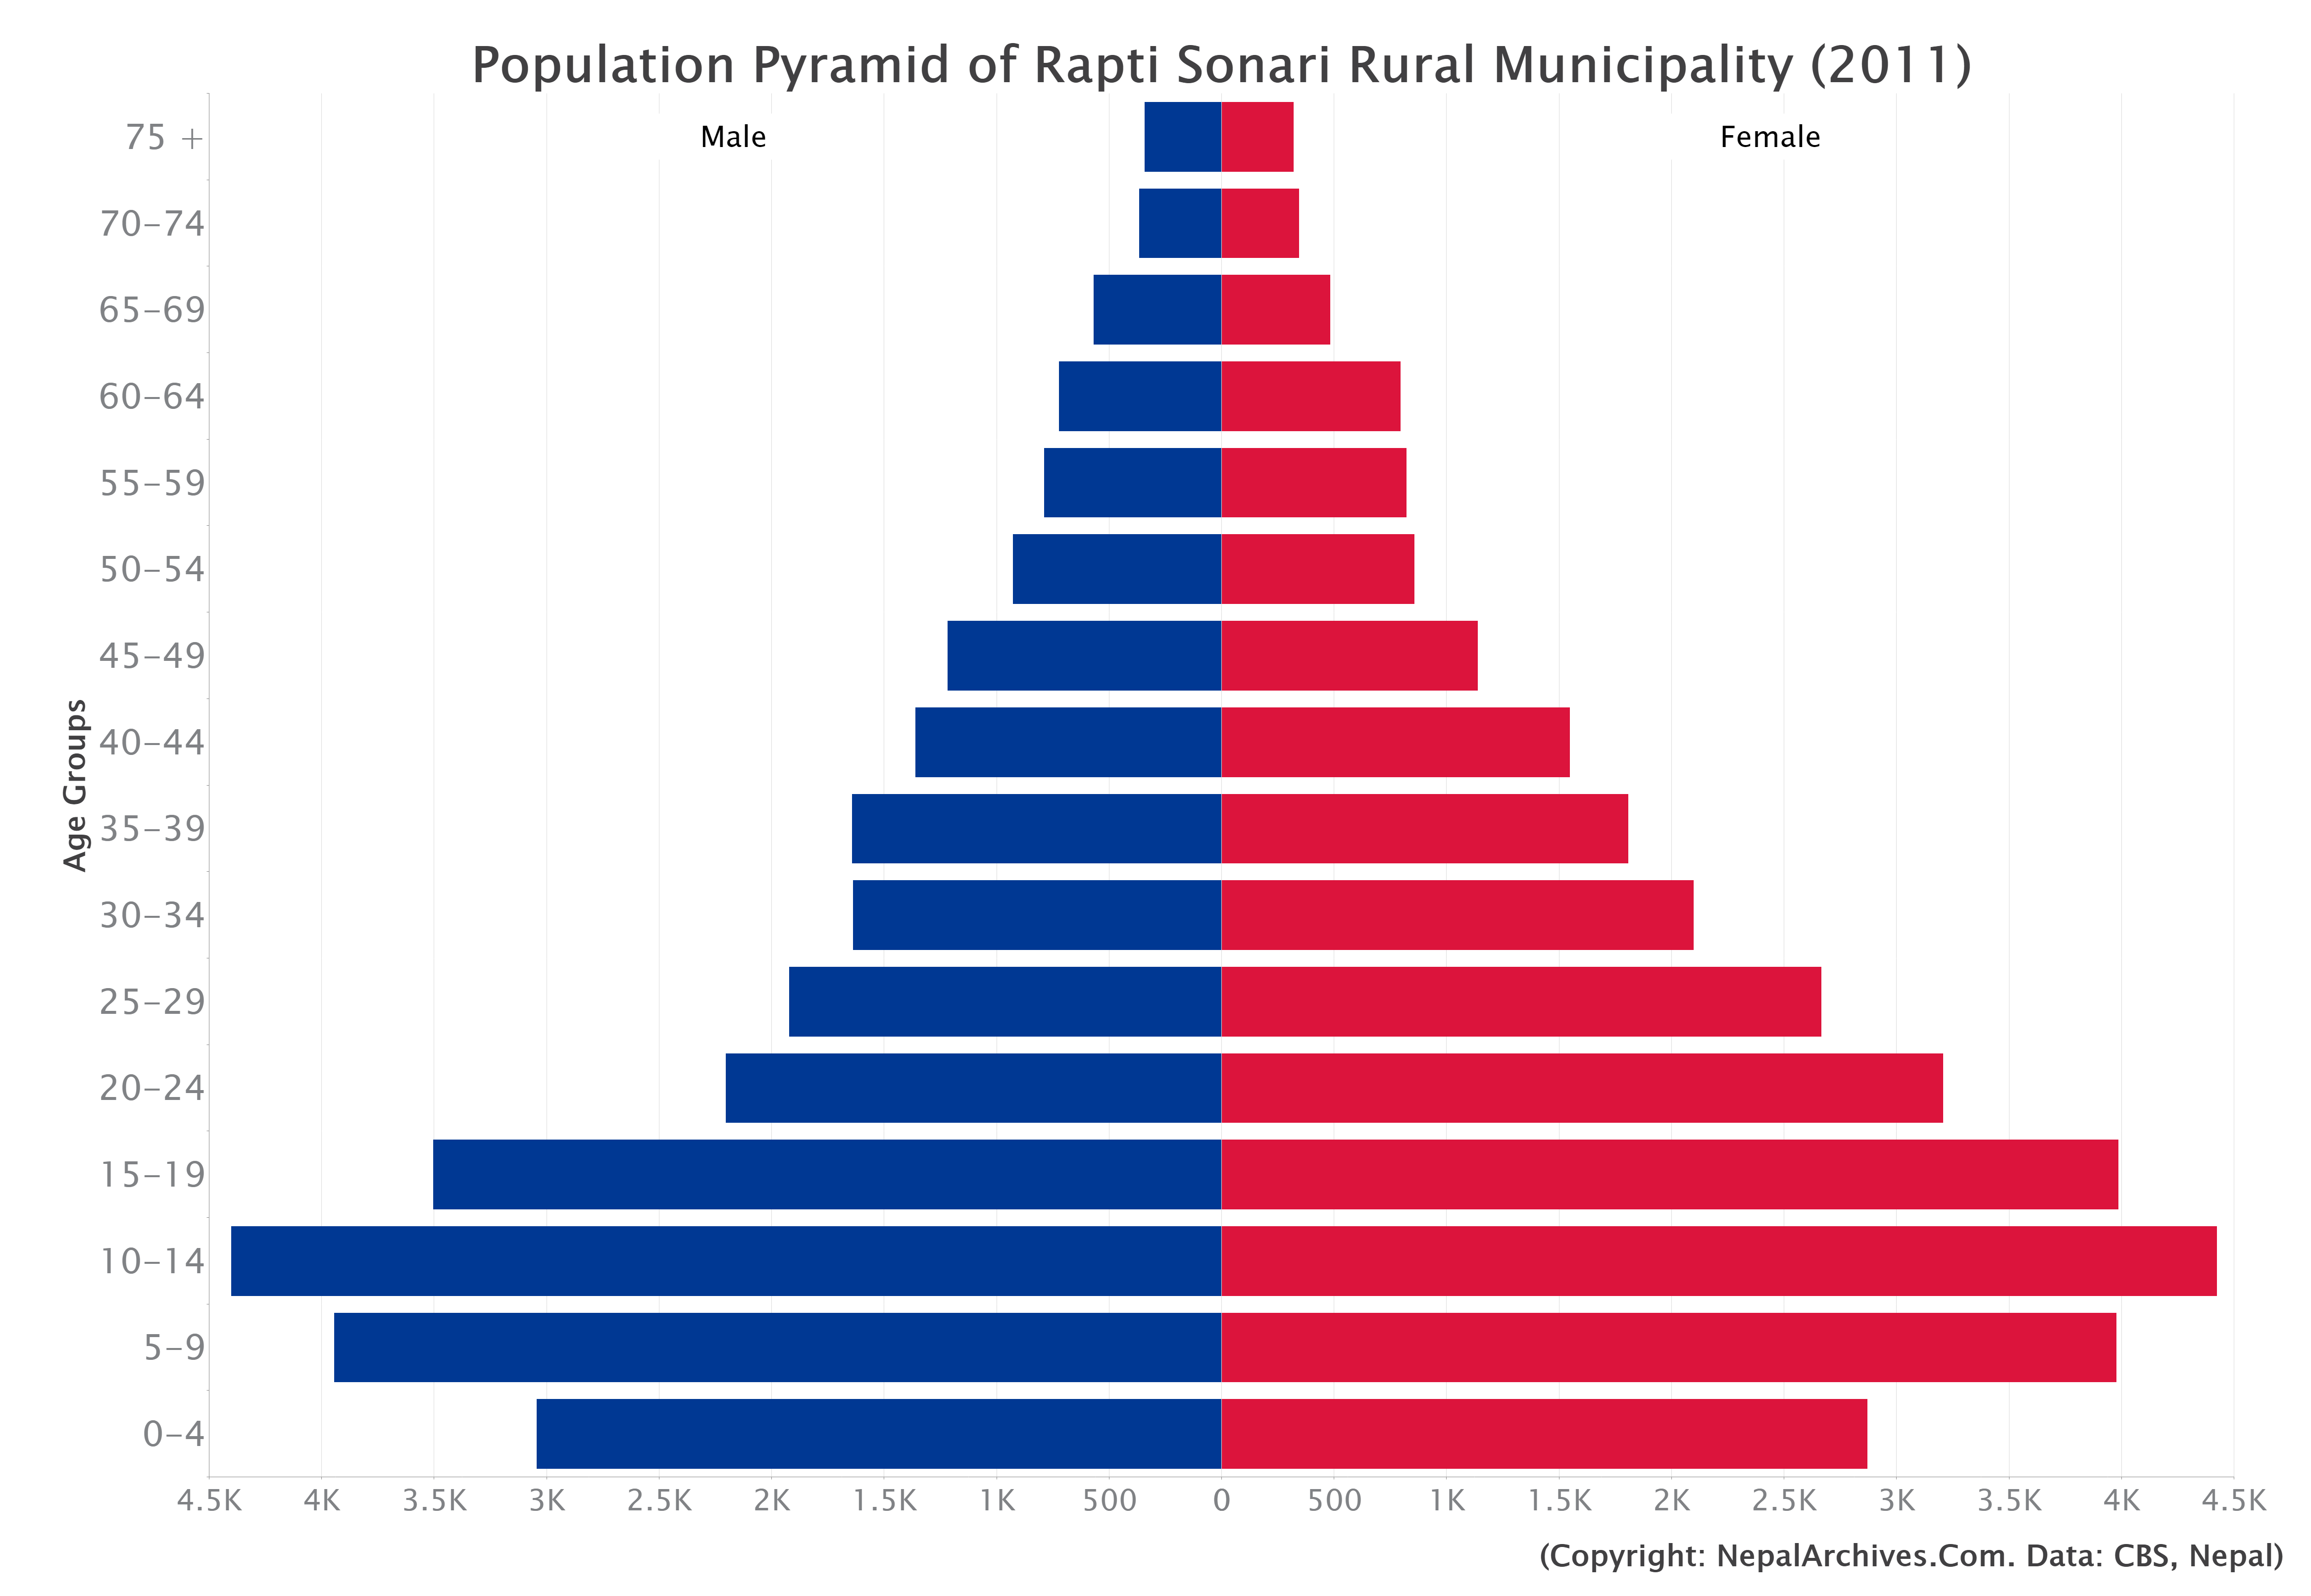
Gender wise, top 5 most age groups male population were between 10 and 14 (4,404), between 5 and 9 (3,946), between 15 and 19 (3,506), below 4 (3,046), and between 20 and 24 (2,205), with total population of 17,107. In contrast, bottom 5 least age group male population were above 75 (343), between 70 and 74 (367), between 65 and 69 (570),between 60 and 64 (725), and between 55 and 59 (790), with total population of 2,795. With regards to female population, top 5 age groups females were between 10 and 14 (4,424), between 15 and 19 (3,986), between 5 and 9 (3,976), between 20 and 24 (3,207), and below 4 (2,869), with total population of 18,462. In contrast, bottom 5 least age group male population were above 75 (318), between 70 and 74 (344), between 65 and 69 (481),between 60 and 64 (795), and between 55 and 59 (820), with total population of 2,758.
The population with age-group 65 to 69 had male to female ratio of 1.19, which states that this age group had maximum males as compared to females. Similarly, age-group 20 to 24 had most female population as compared to male population with male to female ratio of 0.69. The age-groups 65 to 69, 50 to 54, above 75, 45 to 49, 70 to 74, below 4 had majority of male population while age-groups 5 to 9, 55 to 59, 35 to 39, 60 to 64, 15 to 19, 40 to 44, 30 to 34, 25 to 29, 20 to 24 had majority of female population as per male-female ratios. Moreover, age-groups 10 to 14 had eqivalent or almost equal numbers of male and female population with male-female ratios of 1.
The population pyramid for Rapti Sonari Rural Municipality visually illustrates the male vs. female population based on different age groups. The population data and ratio tables are also available in this link.
Population Ratios

There were 58.15 % (34,858 ) of independent population, the working age people between ages of 15 and 64 years. The dependent children, ages below 15 years, were 37.81 % with total number of 22,665. The dependent elderly population, aged 65 and above were 4.04 % with total number of 2,423. As such, total dependent population including children and elderly people were 41.85 with total number of 25,088
There were 16,447 women of child-bearing age-group of 15 to 49 years. Same as, the todlers or children of 4 years or below were 5,915. The ratio of woman of child-bearing age and the number of todlers state that, approximately 360 children were born per 1,000 women. This number is also roughly used as fertility levels when direct measures of births are not available.
Grade 1-12 Students & Schools
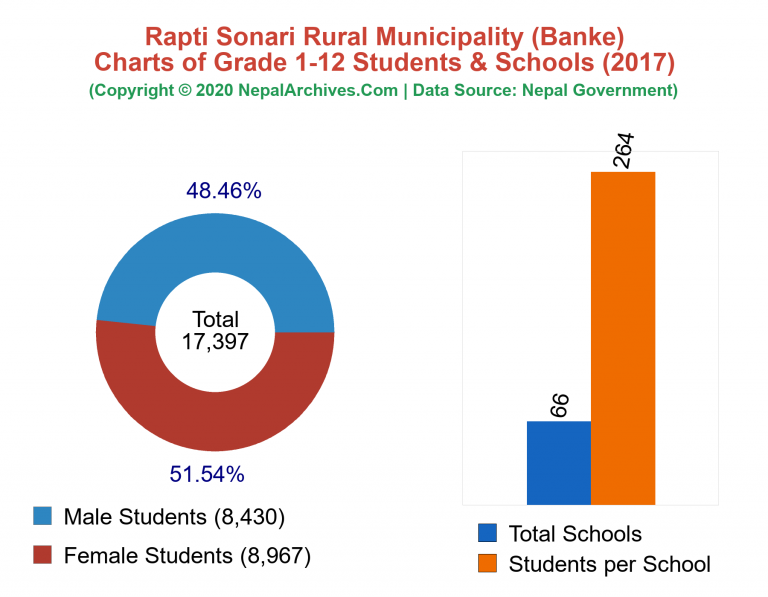
The pie-chart and graphs above further illustrates the students and schools.
Population by Language Spoken
Mostly spoken language in Rapti Sonari is Tharu, which is spoken by 28,961 people. The Rapti Sonari has people who speak other languages, such as Nepali, Avadhi, Urdu, Magar, Maithili, Hindi, Doteli, Newar, Gurung, Kham, Tamang, etc.
 Out of total population, 15,034 female speaks Tharu language, while 13,927 male speaks Tharu language.Details information about languages spoken by male and female groups of population has been illustrated in the table.
Population by Castes
According to 2011 census conducted by Central Bureau of Statistics (CBS), Rapti Sonari Rural Municipality was inhabitted by mostly the people of Tharu caste with total population of 29,515. There were as little as Rajbansi caste with population of as little as 11 in total. People of several other castes who live in Rapti Sonari are Chhetri, Magar, Kami, Muslim, Kumal, Damai/Dholi, Brahmin - Hill, Yadav, Thakuri, Sanyasi/Dashnami, Kayastha, Brahmin - Tarai, Kurmi, Sarki, Chamar/Harijan/Ram, Dhobi, Newar, Badi, Gurung, Foreigner, Mallaha, Hajam/Thakur, Badhaee, Dusadh/Pasawan/Pasi, Teli, Haluwai, Terai Others, Tamang, Kathbaniyan, Kori, Kalwar, Dalit Others, Kumhar, Bhote, Gharti/Bhujel, Limbu, Bangali, Rajbansi, etc. Only the population of castes with above 1,000 population are illustrated in the table.
 Top five castes of people in Rapti Sonari Rural Municipality are Tharu (29,515), Chhetri (12,768), Magar (4,083), Kami (2,633) and Muslim (2,623) with total population of 51,622, which forms 86.11 percent out of total population of 59,946 in Rapti Sonari Rural Municipality.
Population by Disability

Similarly, there were 227 people who were blind and 204 people were deaf, while 13 people were both blind and deaf. Moreover, 108 persons had reported of having speech problems. Total 72 people had multiple disabilities.
The pie-chart above illustrate the better picture of disabled population along with genderwise ratios.
Household Foundation
With respect to wall of the houses, 2,877 houses were mud bonded, 976 houses were cement bonded, 2,788 houses were wood planks bonded, 2,181 houses were bamboo bonded and 1,419 houses had unbaked bricks on their outer walls.Rest of the houses were reported of having other types of outer wall, while some of them reported nothing of having the outer wall bonding.

There were several types of house roofs reported. Total 4,236 houses were reported of having thatch roofs while 755 houses had galvanized roofs. Similarly, 4,788 houses had roof of tile, 843 houses had RCC roofs, 49 houses had roof of woods while 0 houses were reported having roof of mud. As per 2011 CBS census, some of the houses had other types of roofs while some didn't report about the roof structure.
With respect to the toilets, 8,551 out of 10,742 houses didn't report of having a private toilet for their households. Nevertheless, 1,128 houses were reported of having flush toilet while 1,028 houses reported having ordinary toilets.
Utilities

With reference to source of fuel, 10,410 households reported their source of fuel as firewood while 41 households had kerosene as their fuel source. The LP gas was used by 57 households as a source of fuel. Moreover, other sources of fuel were cow dung (18), bio-gas (176), fuel electricity (0), etc.
Same as, total 4,242 households had reported of having electricity as the source of their household's lighting. The households still using kerosene as source of light were 2,399, while 2,298 households used solar energy as source of lights. Total 0 households also reported of using bio-gas as a source of light. The ratio of use of electricity as compared to other source of light was 0.39.
Facilities

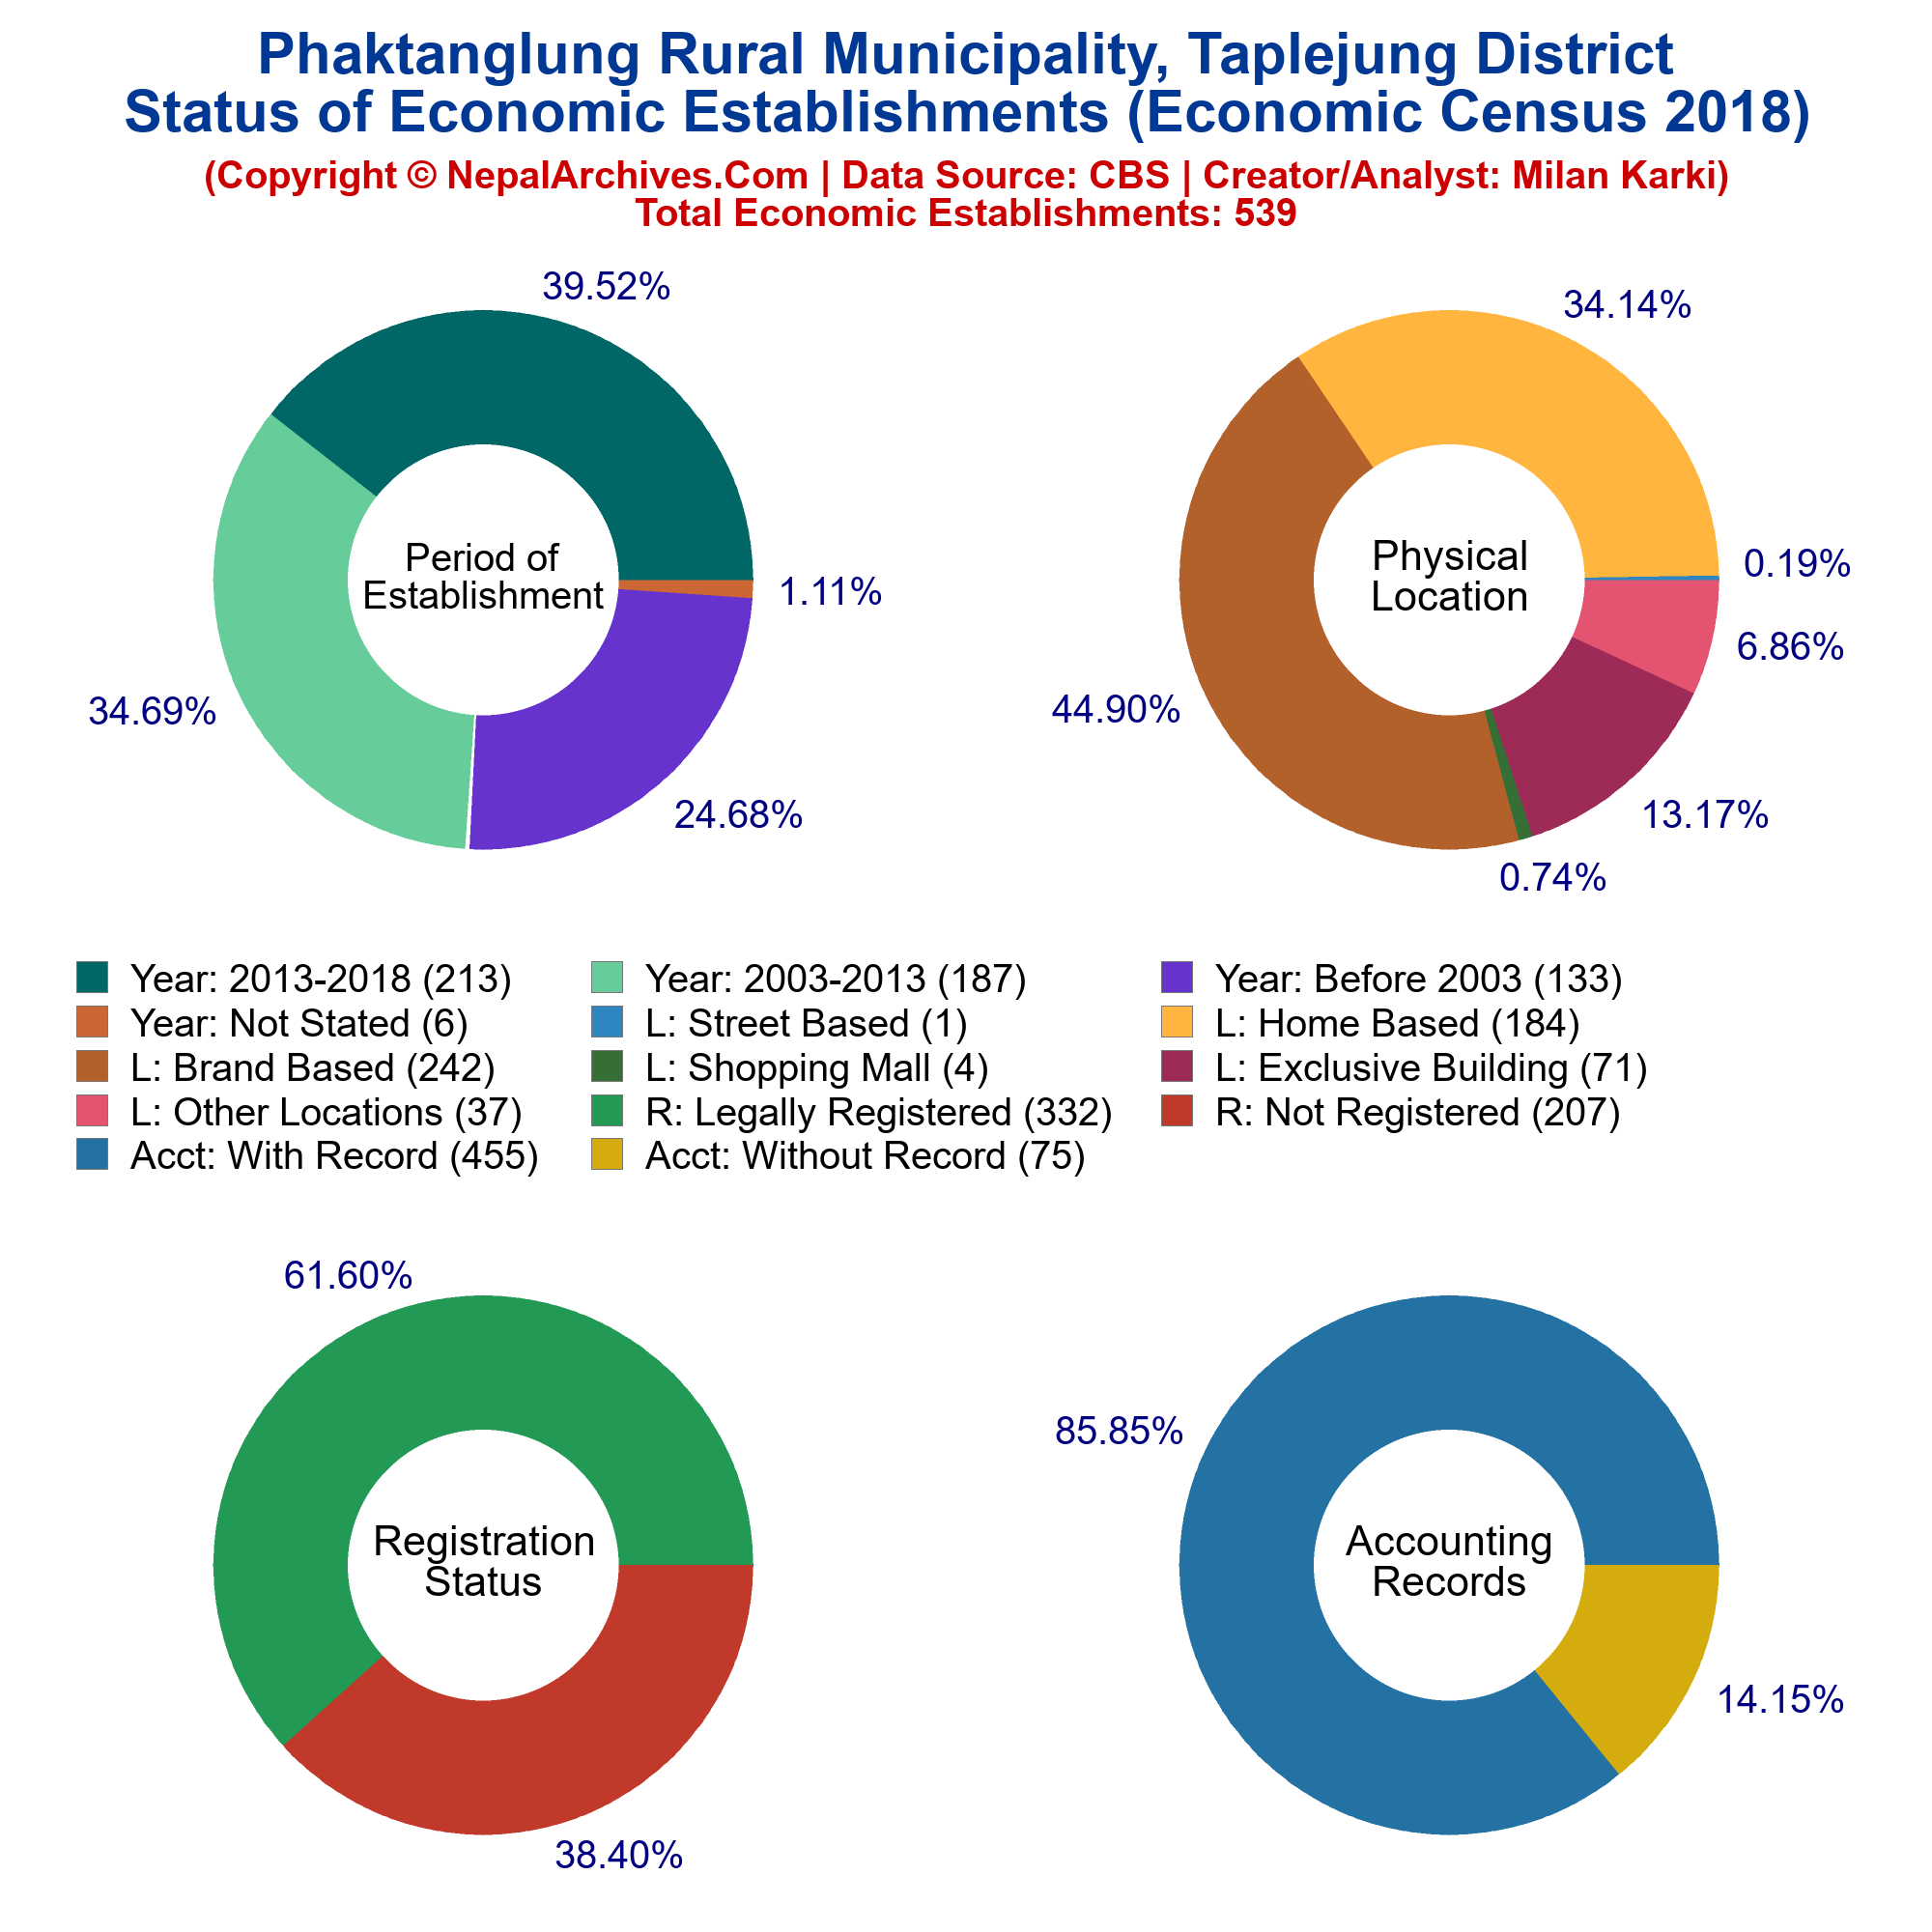
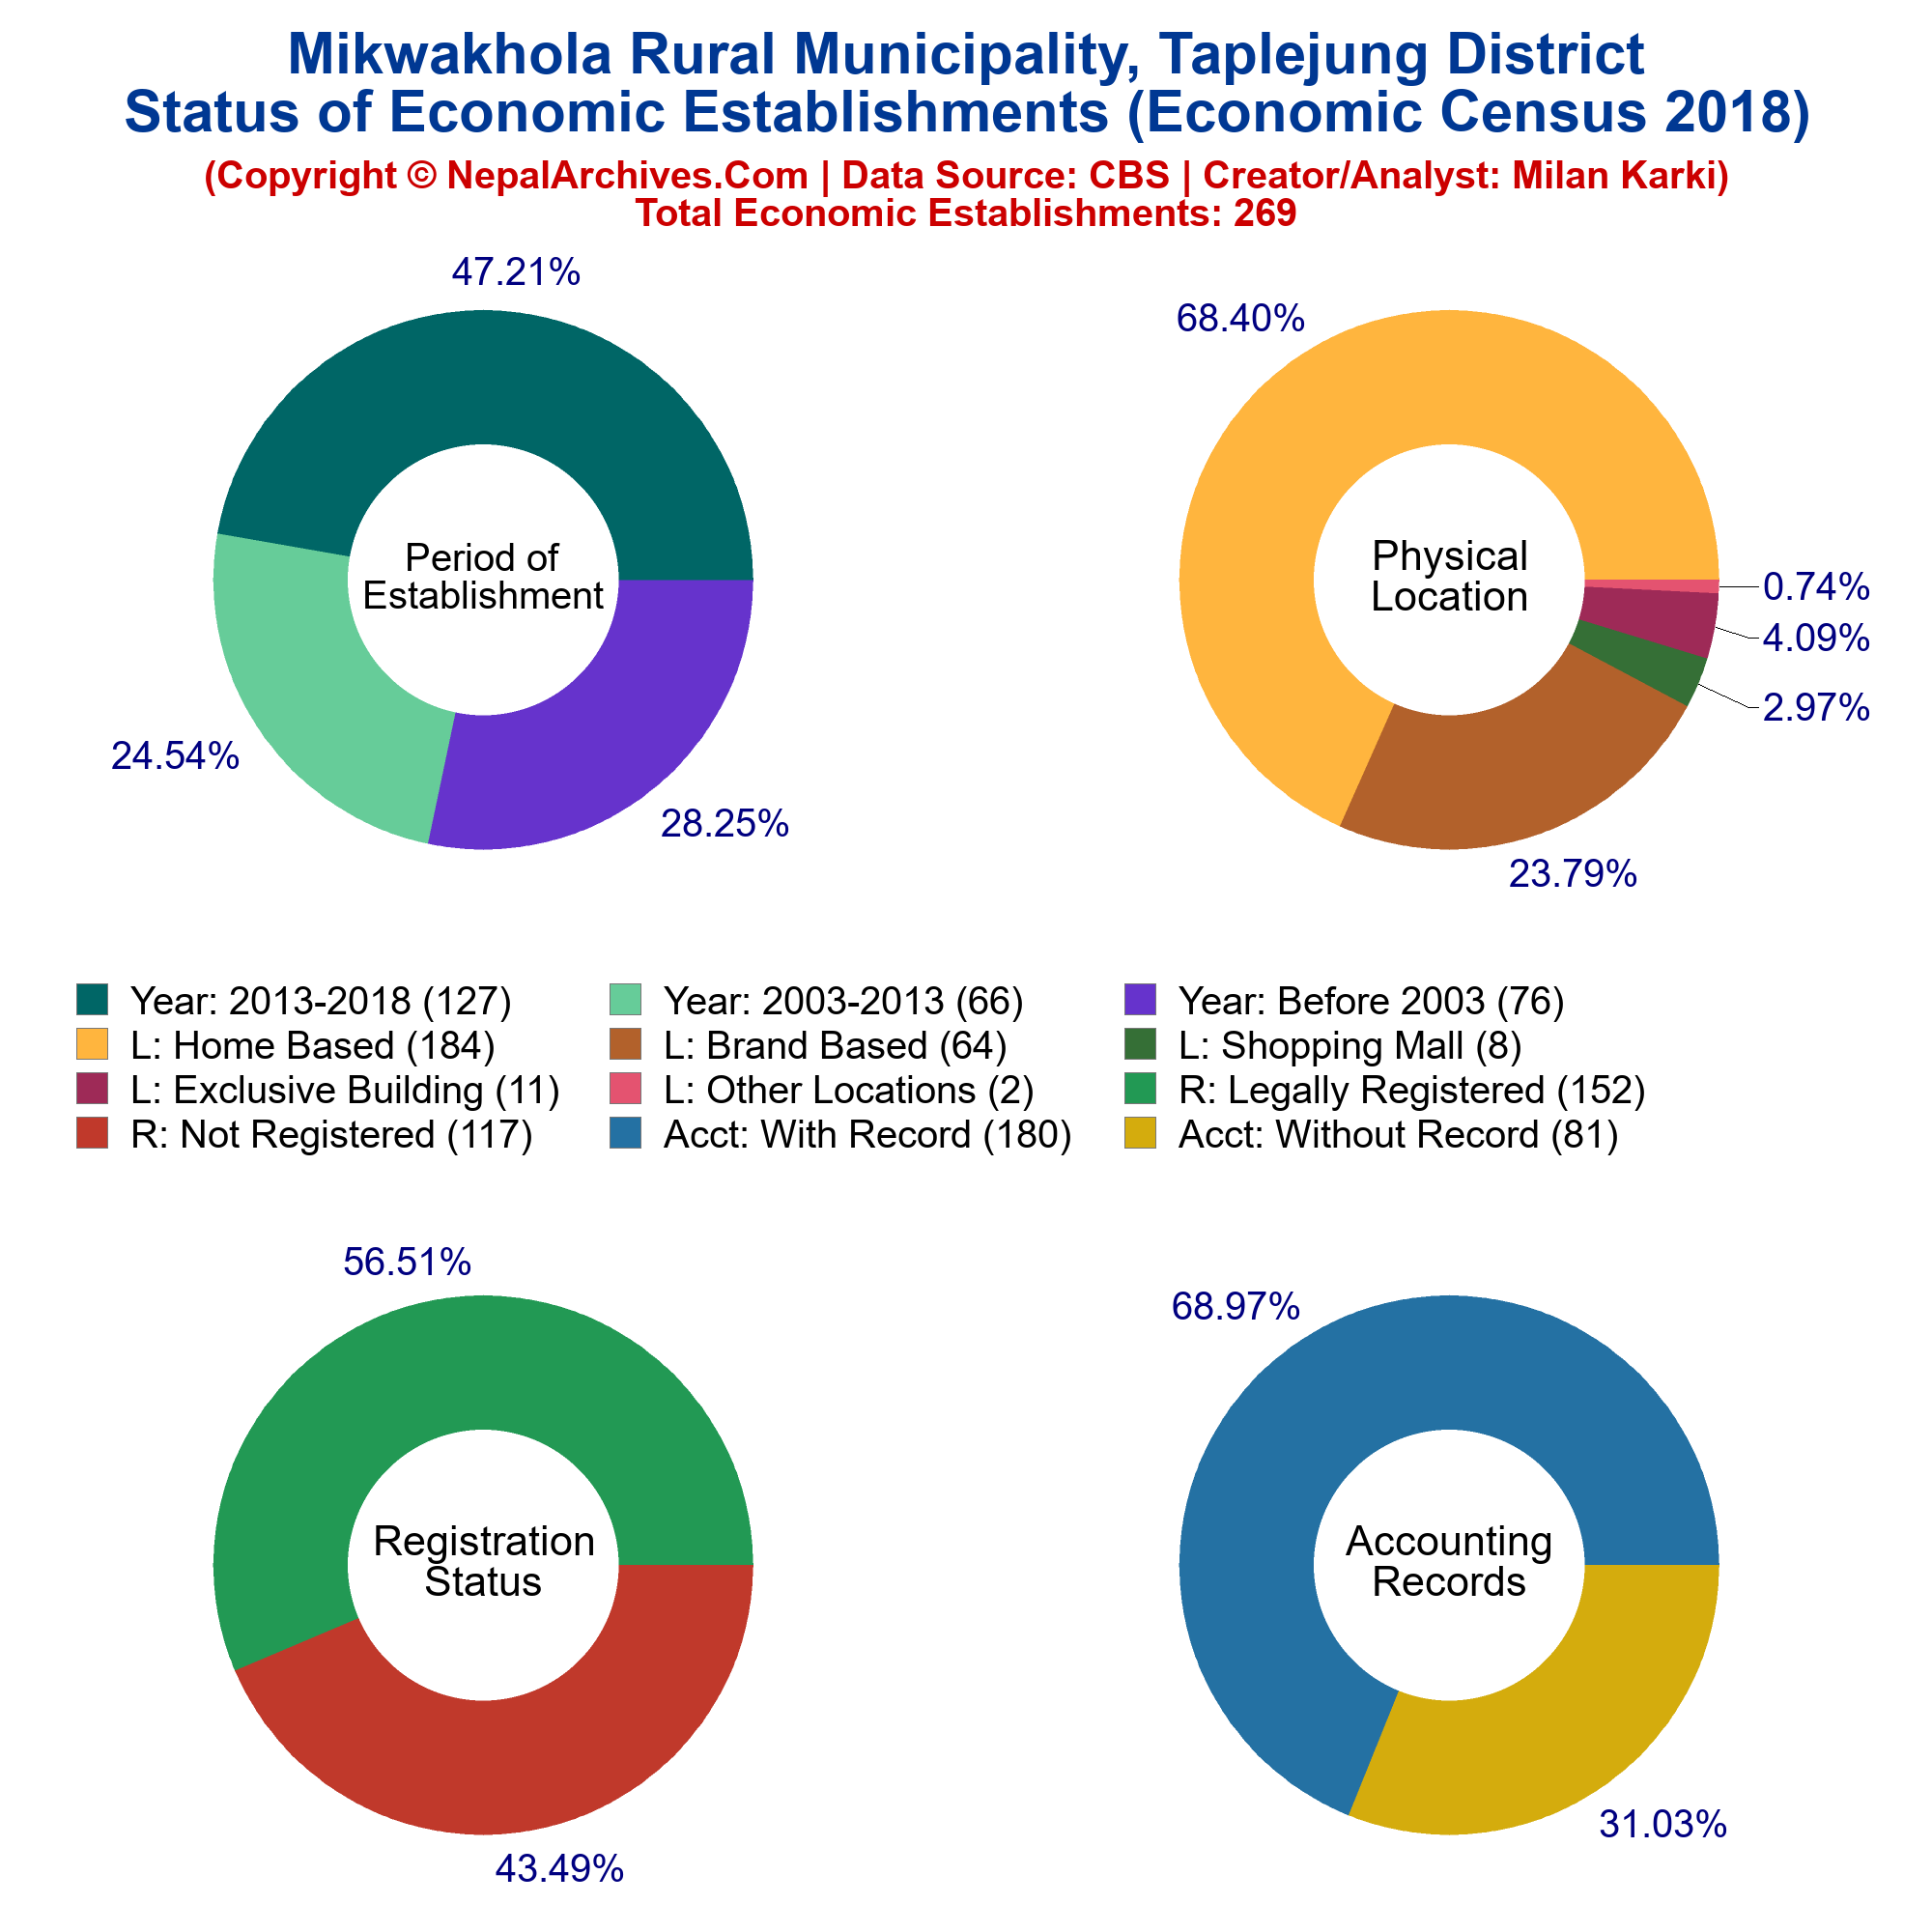
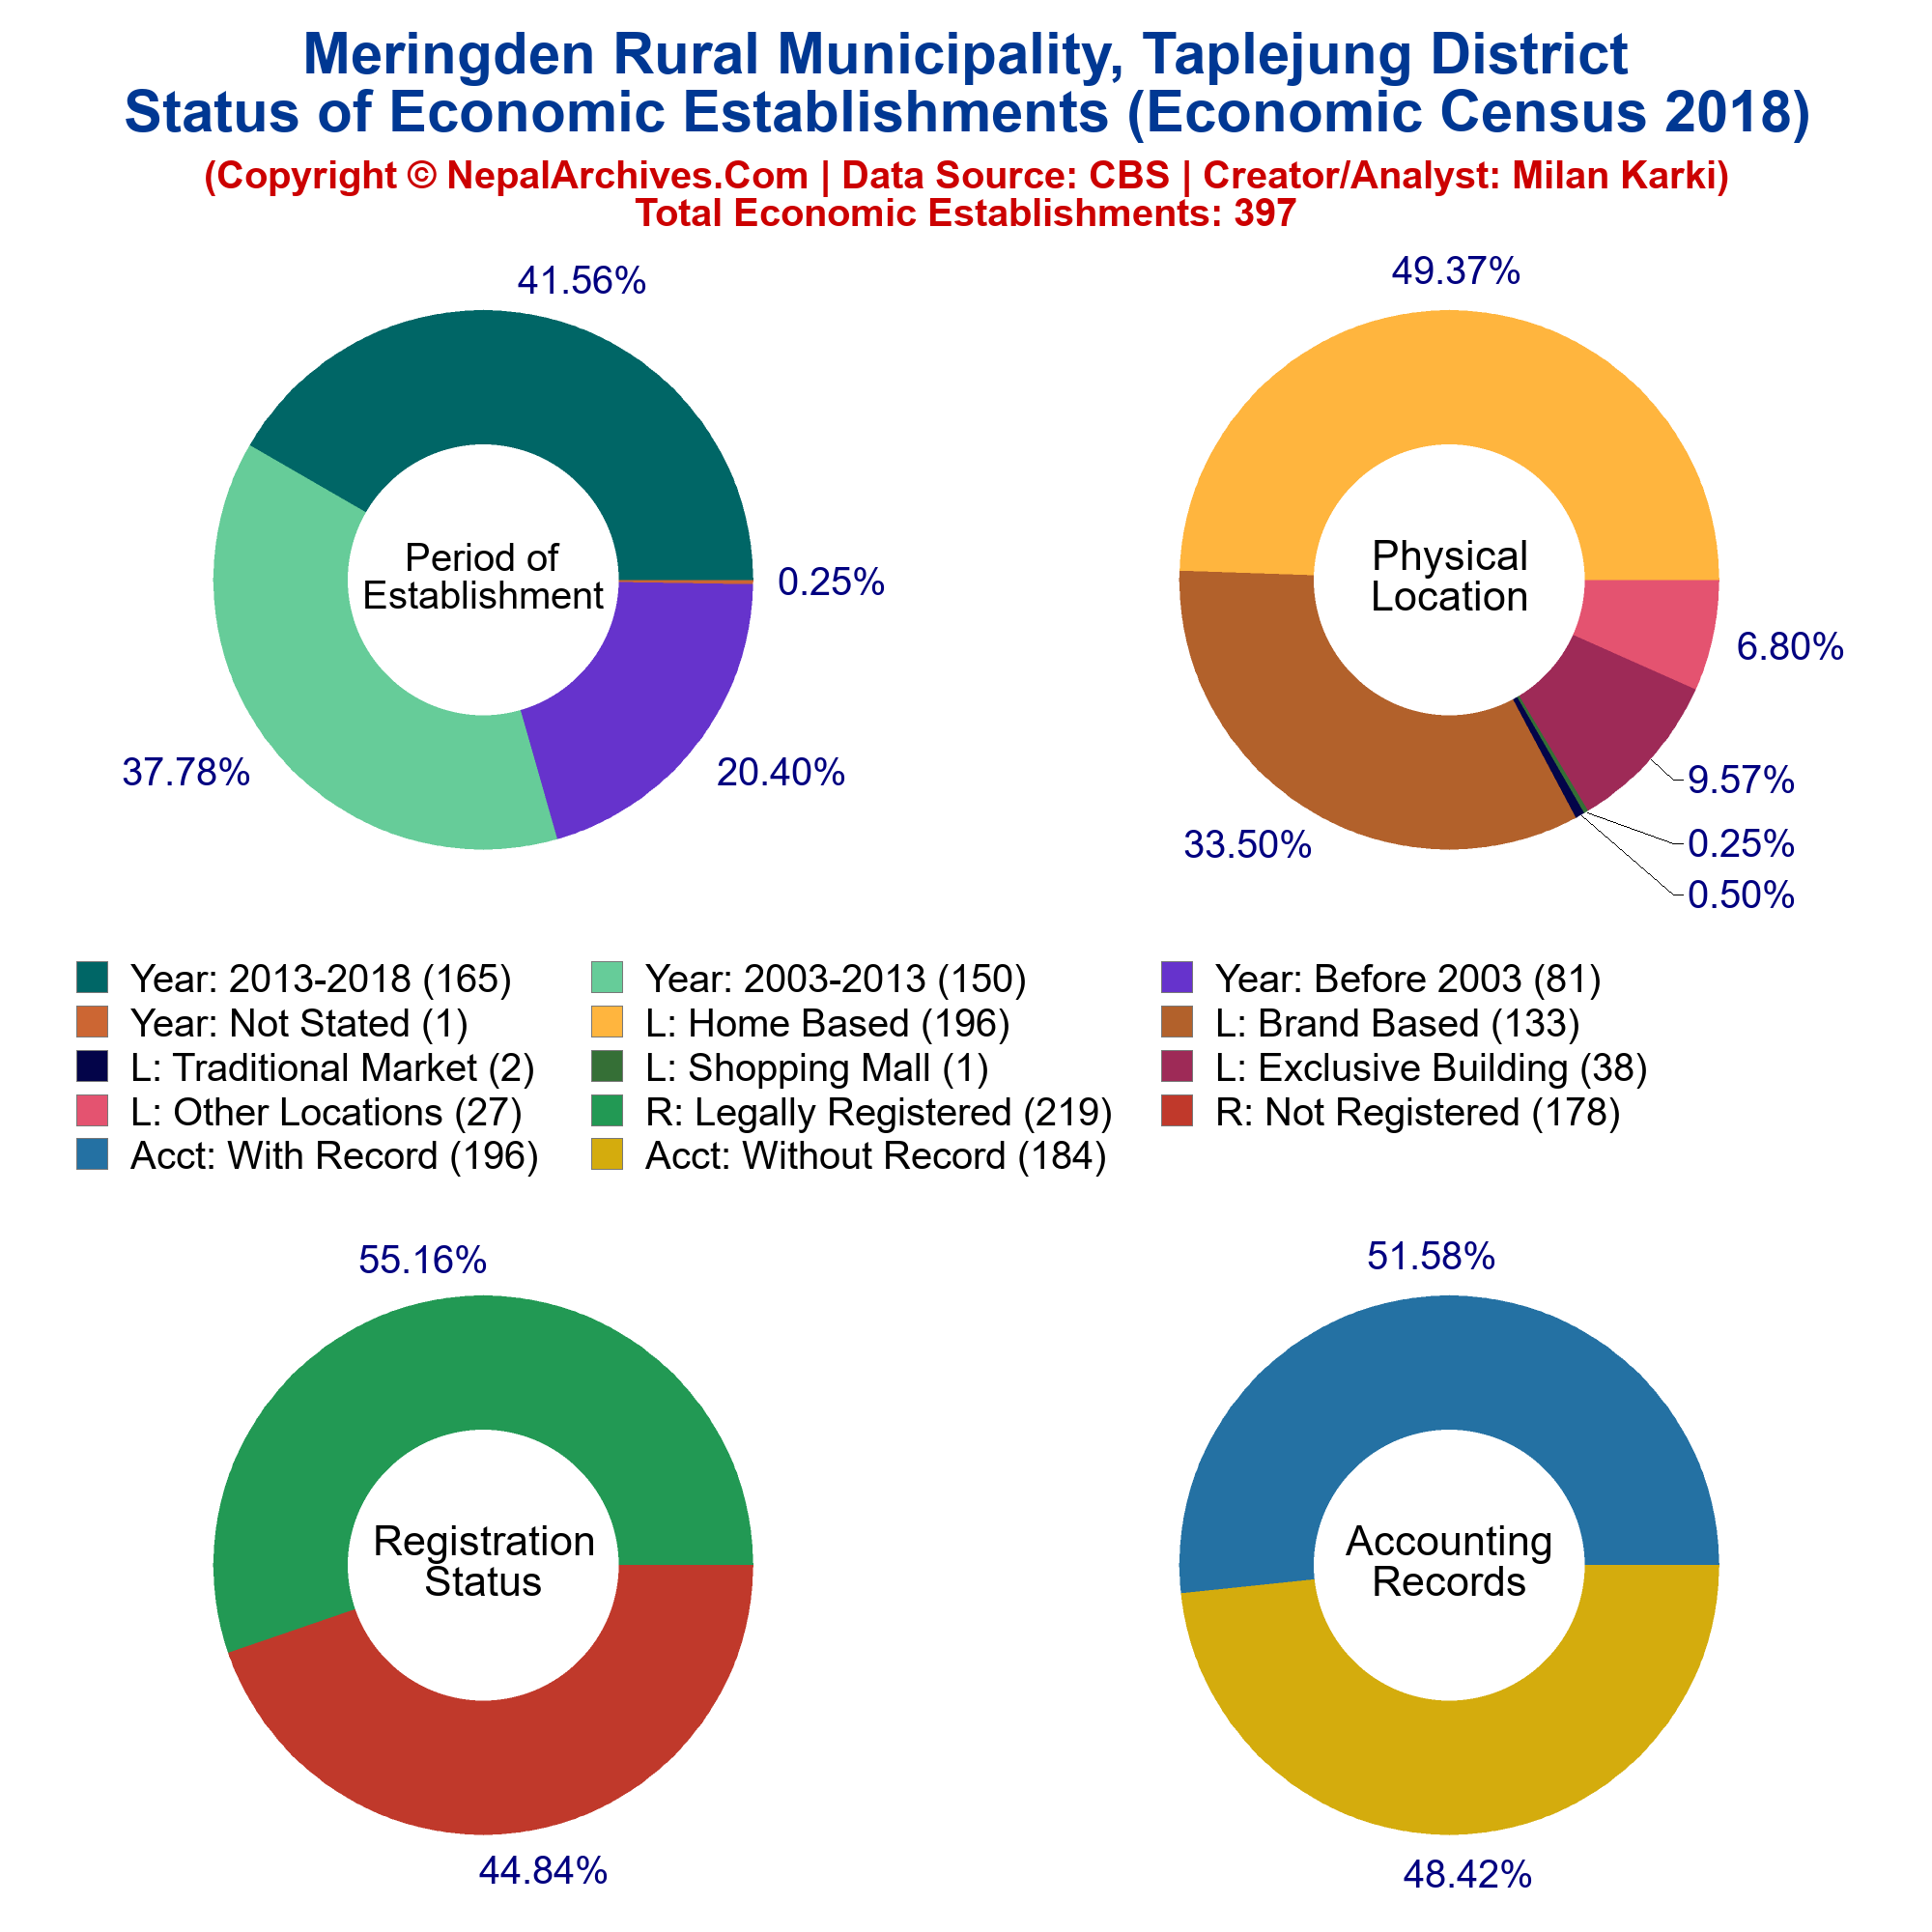
Economic Census
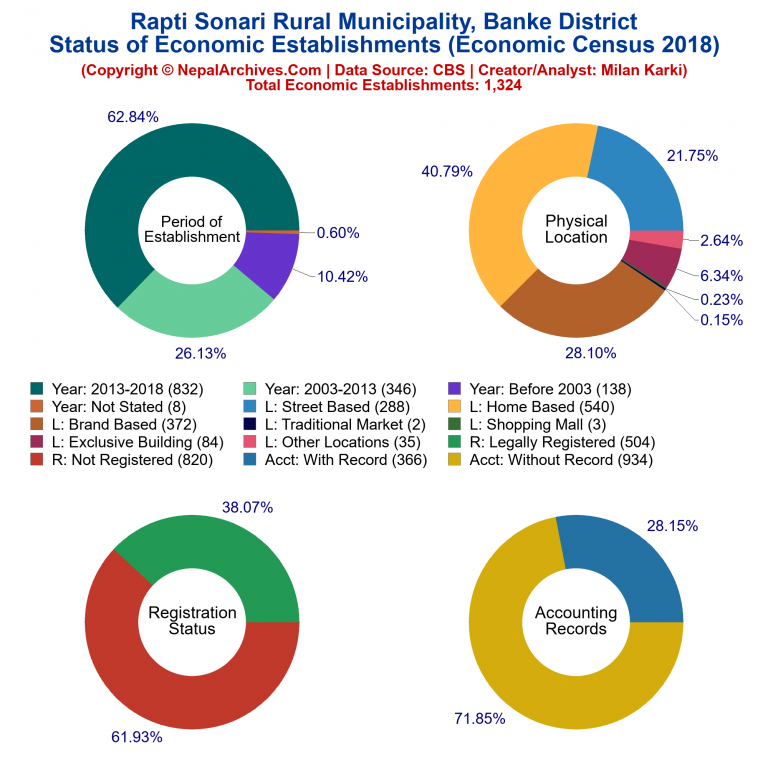 According to 2018 Economic Census, there are total 1,324 establishments in Rapti Sonari Rural Municipality that are involved in various economic activities. In those establishments, total 3,237 persons are engaged for the economic activities, as a self-employed or an employee, with total male engagement of 1,802 and female engagement of 1,435 persons.In every business, there were an average of 2.44 people engaged with average males are 1.36 and females are 1.08. The ratio of male to female engagement in the establishments are 1.26, which means as many as 1.26 males are enagement in the economic activities per female.
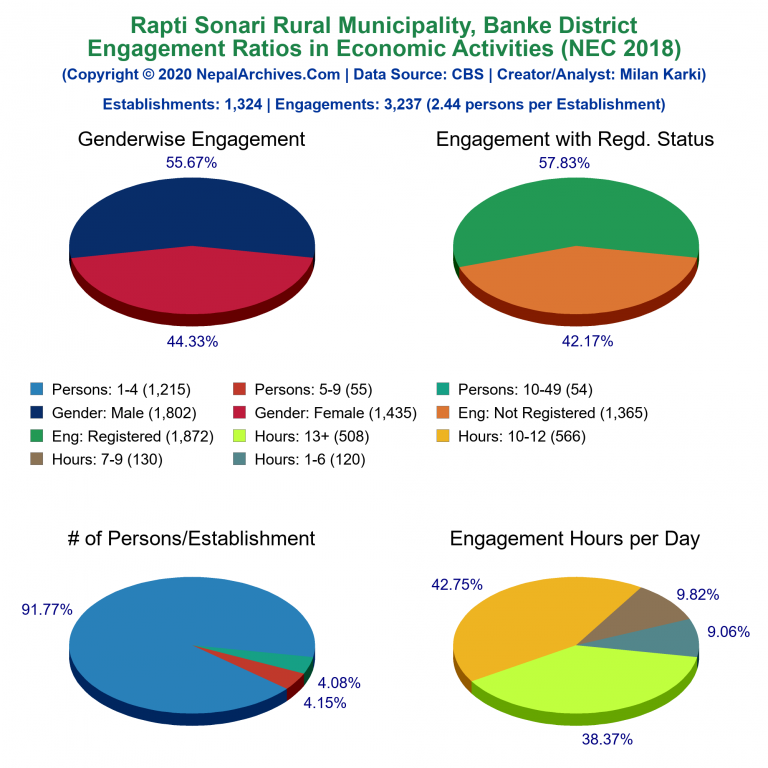 Similarly, the engagement of males were 55.67 percent while the females are 44.33 percent.
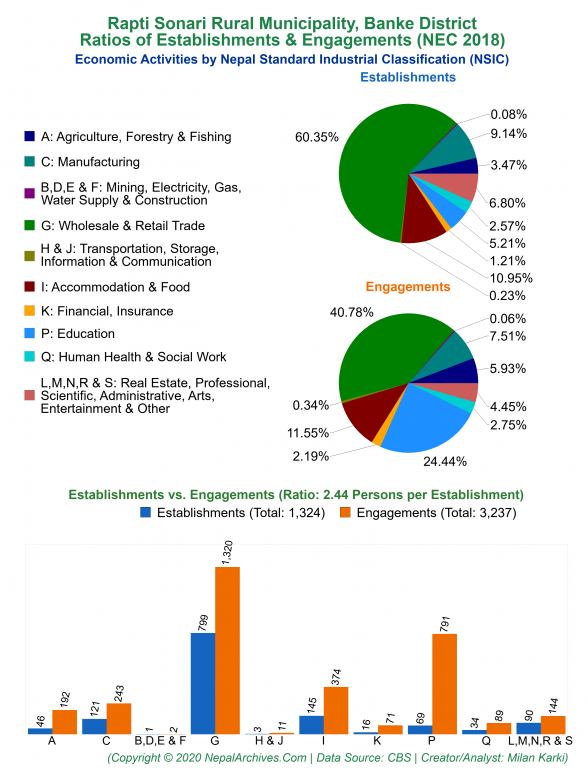
(Desclaimer: The statistical data published about Rapti Sonari Rural Municipality profile in this page are exclusively obtained from Nepal Government's Central Bureau of Statistics (CBS) as well as other verifiable Nepal Government sources. The profile of Rapti Sonari Rural Municipality has been published for information and research only, which can be relied based on its primary source. Nevertheless, NepalArchives.Com does not provide any guaranty of the validity of the stastical information in this page. Any question about the statistical validity of information should be directed to Nepal Government Agency. However, if you found any error or inconsistency of information in this page, please kindly let us know so that we will improve this page. Thank you.)
Milan Karki
Milan Karki is a Registered Investment Advisor (RIA), Management Consultant, Legal Analyst, Software Developer, Researcher & Writer based in New York, USA. He is operating investment advisory and management consulting firm in USA. He holds MBA from Canada, and currently studying Ph.D. in finance in USA. He has written several books in English and Nepali languages. He is originally from Nepal.